from __future__ import division
from numpy import arange, meshgrid, sqrt, zeros, sum
import matplotlib.pyplot as plt
from mpl_toolkits.mplot3d import Axes3D
from matplotlib.ticker import ScalarFormatter
from matplotlib import rcParams

rcParams['font.family'] = 'serif'
rcParams['font.size'] = 16

# the layout of the duct laminar
x_max = 5 # duct length
y_max = 1 # duct width

# draw the frames, including the angles and labels
ax = Axes3D(plt.figure(figsize=(10, 8)), azim=20, elev=20)
ax.set_xlabel(r"$x$", fontsize=20)
ax.set_ylabel(r"$y$", fontsize=20)
ax.zaxis.set_rotate_label(False)
ax.set_zlabel(r"$v_x$", fontsize=20, rotation='horizontal')
formatter = ScalarFormatter(useMathText=True)
formatter = ScalarFormatter()
formatter.set_scientific(True)
formatter.set_powerlimits((-2,2))
ax.w_zaxis.set_major_formatter(formatter)
ax.set_xlim([0, x_max])
ax.set_ylim([0, y_max])

# initial speed of the air
ini_v = 3e-3
mu = 1e-5
rho = 1.3

# the acceptable difference when termination
accept_diff = 1e-5
# time interval
time_delta = 1.0
# coordinate interval
delta = 1e-2;
X = arange(0, x_max + delta, delta)
Y = arange(0, y_max + delta, delta)
# number of coordinate points
x_size = len(X) - 1
y_size = len(Y) - 1
Vx = zeros((len(X), len(Y)))
Vy = zeros((len(X), len(Y)))
new_Vx = zeros((len(X), len(Y)))
new_Vy = zeros((len(X), len(Y)))

# initial conditions
Vx[1: x_size - 1, 2:y_size - 1] = ini_v


# start evolution and computation
res = 1 + accept_diff
rounds = 0
alpha = mu/(rho * delta**2)
while (res>accept_diff and rounds<100):
    """
    The iterations here are based on the velocity change rate, which
    is given by

    \frac{\partial v}{\partial t} = \alpha\nabla^2 v - v \cdot \nabla v

    with \alpha = \mu/\rho.
    """
    new_Vx[2:-2, 2:-2] = Vx[2:-2, 2:-2] +  time_delta*(alpha*(Vx[3:-1, 2:-2] +
        Vx[2:-2, 3:-1] - 4*Vx[2:-2, 2:-2] + Vx[2:-2, 1:-3] + Vx[1:-3, 2:-2]) -
        0.5/delta * (Vx[2:-2, 2:-2] * (Vx[3:-1, 2:-2] - Vx[1:-3, 2:-2]) +
        Vy[2:-2, 2:-2]*(Vx[2:-2, 3:-1] - Vx[2:-2, 1:-3])))

    new_Vy[2:-2, 2:-2] = Vy[2:-2, 2:-2] + time_delta*(alpha*(Vy[3:-1, 2:-2] +
        Vy[2:-2, 3:-1] - 4*Vy[2:-2, 2:-2] + Vy[2:-2, 1:-3] + Vy[1:-3, 2:-2]) -
        0.5/delta * (Vy[2:-2, 2:-2] * (Vy[2:-2, 3:-1] - Vy[2:-2, 3:-1]) +
        Vx[2:-2, 2:-2]*(Vy[3:-1, 2:-2] - Vy[1:-3, 2:-2])))

    rounds = rounds + 1

    # copy the new values
    Vx[2:-2, 2:-2] = new_Vx[2:-2, 2:-2]
    Vy[2:-2, 2:-2] = new_Vy[2:-2, 2:-2]


    # set free boundary conditions: dv_x/dx = dv_y/dx = 0.
    Vx[-1, 1:-1] = Vx[-3, 1:-1]
    Vx[-2, 1:-1] = Vx[-3, 1:-1]
    Vy[-1, 1:-1] = Vy[-3, 1:-1]
    Vy[-2, 1:-1] = Vy[-3, 1:-1]

    # there exists a still object in the plane
    Vx[x_size//3:x_size//1.5, y_size//2.0] = 0
    Vy[x_size//3:x_size//1.5, y_size//2.0] = 0

    # calculate the residual of Vx
    res = (Vx[3:-1, 2:-2] + Vx[2:-2, 3:-1] -
           Vx[1:-3, 2:-2] - Vx[2:-2, 1:-3])**2
    res = sum(res)/(4 * delta**2 * x_size * y_size)

# prepare the plot data
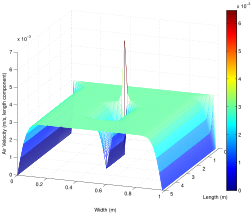
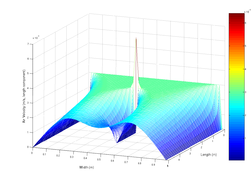
Z = sqrt(Vx**2)

# refine the region boundary
Z[0, 1:-2] = Z[1, 1:-2]
Z[-2, 1:-2] = Z[-3, 1:-2]
Z[-1, 1:-2] = Z[-3, 1:-2]

Y, X = meshgrid(Y, X);
ax.plot_surface(X, Y, Z, rstride=1, cstride=1, cmap="summer", lw=0.1,
                edgecolors="k")
plt.savefig("Navier_Stokes_Laminar.svg")


